

Discover the captivating tourism trends of a specific Caribbean island over a seven-year period, commencing in 2010, vividly illustrated in the accompanying line graph.
Throughout this duration, there\’s a discernible surge in the overall tourist influx to the Caribbean Island, portraying its growing popularity. Notably, the preference for staying on the island outpaced that of opting for cruise ship accommodations.
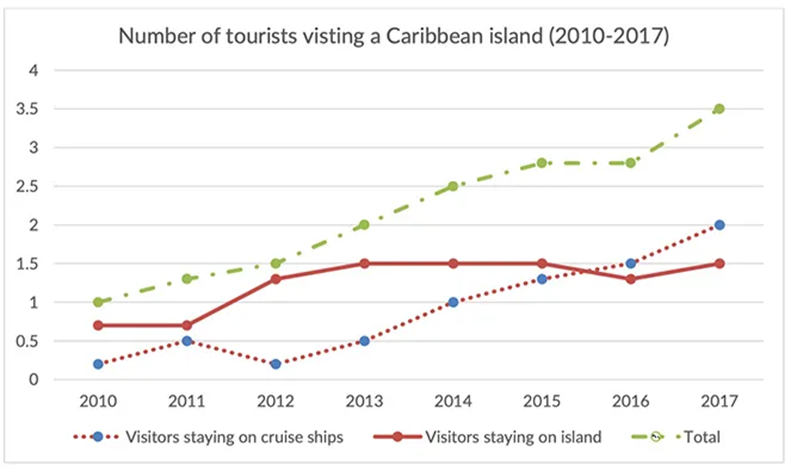
In 2010, the Caribbean Island hosted a million tourists, with seventy-five thousand opting for an island stay, while the rest favored cruise ship experiences. Over the next two years, cruise ship stays experienced a slight dip to just under 0.25 million. In contrast, island stays continued to be the preferred choice, attracting 1.25 million visitors.
The most remarkable shift occurred in the final year, witnessing a staggering 3.5 million visitors to the Caribbean Island. Simultaneously, cruise ship enthusiasts surged to almost 2 million, surpassing island stays by half a million. This data not only reflects the island\’s burgeoning tourism but also reveals an evolving preference, showcasing the allure of cruise ship adventures in the latter years of this compelling seven-year narrative. Dive into the evolving travel choices that shaped the Caribbean Island\’s tourism landscape over this intriguing period.


