

Question – The bar chart below shows the percentage of Australian men and women in different age groups who did regular physical activity in 2010.
Summarise the information by selecting and reporting the main features, and make comparisons where relevant. Write atleast 150 words.
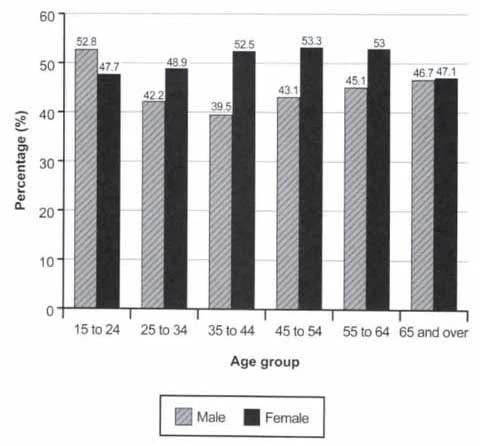
The bar chart presents the 2010 data on the percentage of Australian men and women participating in regular physical activity across different age groups. Analyzing the chart reveals age-dependent variations in engagement levels. Younger individuals, both men and women, exhibit higher activity rates, reflecting positive health-conscious trends among the youth.
In middle age groups, a noticeable decline in physical activity percentages is observed for both genders. Factors such as increased work and family commitments may contribute to this decline, limiting available time for recreational activities.
Contrastingly, there is a surprising resurgence in physical activity among older men, indicating a growing awareness of its importance for health and well-being. However, women in older age groups maintain lower participation rates.
In conclusion, the bar chart provides a snapshot of physical activity prevalence among Australian men and women in 2010. Age proves pivotal, with younger individuals generally displaying higher engagement. Understanding these patterns is crucial for health policymakers and educators to tailor interventions, particularly for demographics at risk of reduced physical activity.


