Category: IELTS Academic Writing Task 1

  • The diagram below shows how instant noodles are manufactured. IELTS Cambridge 15 – Test 3 (Task 1)

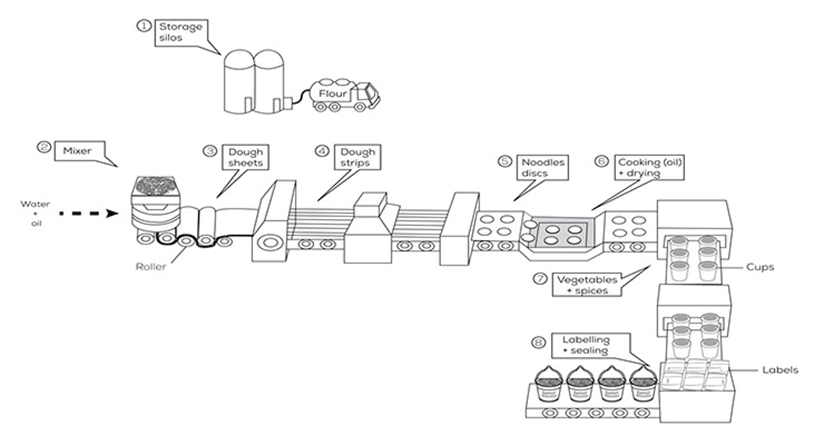
    The illustration captures the detailed process of manufacturing instant noodles. To sum up, this sequential procedure involves eight distinct stages, starting with storing flour in silos and concluding with carefully labeling and sealing cups.

    The initial phase requires pumping flour from a truck into tower silos for temporary storage, followed by blending it with oil and water in a mixing machine. The ultimate step involves rolling the blended mixture to create dough sheets, subsequently using a machine to separate them into strips.

    Continuing, the process shapes these dough strips into disc-shaped noodles, subjects them to oil cooking, and allows them to dry. After drying, the noodle discs are combined with a variety of spices and vegetables before being meticulously placed into packaging cups.

    The entire procedure concludes with systematically labeling and sealing these cups, ensuring the production of high-quality instant noodles. This comprehensive process showcases the precision and care involved at each stage of instant noodle production.

  • The chart below shows what Anthropology graduates from one university did after finishing their undergraduate degree course. The table shows the salaries of the anthropologists in work after five years. IELTS Cambridge 15 – Test 4 (Task 1)

    After completing their undergraduate degrees in Anthropology, a pie chart depicts the employment situation of graduates from a specific university, while a table illustrates the salaries of three different types of employment for Anthropologists after five years.

    The largest proportion of Anthropology graduates chose to pursue postgraduate study and part-time employment, contrasting with those who opted for part-time employment exclusively. After five years, the percentages of anthropologists in the government sector with the highest salary range and those working as independent consultants were identical, while the highest percentage was observed among those in the government sector with the lowest salary range.

    The pie chart indicates that 52% of anthropology graduates worked full-time, with lower percentages for those unemployed or working part-time at 12% and 15%, respectively. Only 5% of Anthropology graduates chose part-time jobs while pursuing postgraduate studies, with the same numbers for those opting for full-time postgraduate study and the unidentified group, both at 8%.

    In reference to the table, graduates of anthropology programs earning between $25,000 and $499,999 had the lowest percentage of individuals employed as independent contractors and in the government after five years—just 5%, or half as much as those in private enterprises. However, the percentages of people with the highest salaries in the table—40%, 50%, and 30%—who work as independent consultants, in the public sector, and in private businesses were significantly higher.

  • The charts below show the changes in ownership of electrical appliances and amount of time spent doing housework and households in one country between 1920 and 2019. IELTS Cambridge 16 – Test 1 (Task 1)

    The process diagram illustrates the recycling of plastic bottles, comprising a total of nine steps. It begins with individuals discarding bottles in the trash and progresses through factory processes utilizing specialized machinery, concluding with the production of items from recycled plastic before restarting the cycle.

    Commencing with the initial three steps, involving collecting and sorting plastic, plastic bottles are initially discarded into garbage bins. Garbage trucks then collect these bins, and the plastic bottles reach a recycling center where manual sorting distinguishes recyclable from non-recyclable bottles.

    The subsequent steps focus on processing recyclable plastic, starting with compressing the recyclable material. Creating recyclable plastic becomes the primary objective in the following stages, where compressed blocks are fed into a grinder, crushed, and placed in a washing tank. Afterward, the plastic undergoes a pellet-forming process through a machine.

    In the remaining stages, the plastic pellets are heated to form raw material suitable for plastic product manufacturing, stacked on pallets for storage. Following this, finished products are created from the raw material. Some completed goods may end up discarded in trash cans, subsequently re-entering the recycling process.

  • How sugar is produced from sugarcane. IELTS Cambridge 16 – Test 2 (Task 1)

    \"\"

    Question – The diagram below shows the manufacturing process for making sugar from sugar cane. Summarise the information by selecting and reporting the main features, and make comparisons where relevant. Write atleast 150 words .

    The diagram illustrates the step-by-step manufacturing process for producing sugar from sugar cane. Initially, workers manually cut mature sugar cane and transport it to the processing facility. The second phase includes crushing the harvested sugar cane to extract juice, a crucial step in sugar production.

    After extracting juice, the subsequent stage focuses on purifying and clarifying. The juice undergoes heating and treatment with lime to eliminate impurities, resulting in a clarified liquid. This liquid then undergoes further processing through multiple filtration stages to ensure the removal of any residual solids.

    The final steps involve concentrating and crystallizing the purified liquid. Boiling the clarified juice reduces its water content, forming a concentrated syrup. Gradually, the syrup undergoes crystallization, producing sugar crystals. The end product is refined sugar ready for packaging and distribution.

    In summary, the sugar manufacturing process involves harvesting and crushing sugar cane, extracting juice, purifying and clarifying the liquid, and finally concentrating and crystallizing it to produce refined sugar. The diagram offers a comprehensive overview of the sequential stages in creating sugar from sugar cane.

  • Site of an Airport Now and after Redevelopment. IELTS Cambridge 16 – Test 3 (Task 1)

    \"\"

    Question Site of an Airport Now and after Redevelopment. The plans below show the site of an airport now and how it will look after redevelopment next year.Summarise the information by selecting and reporting the main features and make comparisons where relevant. Write atleast 150 words.

  • The diagram below shows the process for recycling plastic bottles. Summarise the information by selecting and reporting the main features, and make comparisons where relevant. IELTS Cambridge 16 – Test 4 (Task 1)

    \"\"

    Question – The diagram below shows the process for recycling plastic bottles. Summarise the information by selecting and reporting the main features, and make comparisons where relevant. Write atleast 150 words.

    The image shows how to recycle plastic bottles and reuse plastic to create goods in other places. This procedure involves nine distinct steps in total, beginning with the trash can and concluding with the creation of goods.

    In the beginning, plastic bottles were thrown in the dustbin. The garbage van would then gather the bottles, which would then travel in a van to recycling facilities. One person sorts the plastic bottles in the third step and places them in the box marked \”used\” or \”not used.\” In the fifth step, the bottles in the used box are crushed and cleaned inside a box after being compressed into the blocks.

    Furthermore, the machine that produces plastic pellets in the sixth step uses the crushed plastic. Pellets are heated in a subsequent step to become raw materials, which are then used to make a variety of products, including pencils, bags, t-shirts, and many more.

    In summary, plastic is not only bad for the environment but can also be reused if everyone throws it in a dustbin, where it can be recycled into different materials that people can use.

  • Map of an Industrial Area (Norbiton). IELTS Cambridge 17 – Test 1 (Task 1)

    \"\"

    Question – The maps illustrate an industrial area in Norbiton in the present day compared with plans for future development of the site.Summarise the information by selecting and reporting the main features, and make comparisons where relevant.

    The maps show an industrial area in Norbiton now in contrast to the planned development of the area in the next years.

    All in all, it is clear that the future plan will have a significant impact on infrastructure modifications.

    First off, the layout\’s northern boundary under the current plan is marked by a river, and the area beyond it is agricultural land. But there isn\’t a bridge that helps laborers cross the river to the opposite side. It\’s interesting to note that under the future design, a bridge links the town\’s center to the countryside located beyond the river. Additionally, industries dominate the town\’s core area, extending to the eastern corner. However, in the next years, it is anticipated that the majority of the manufacturing buildings will be replaced by residential construction.

    Additionally, the current plan has a small amount of infrastructure, but the future layout will have more infrastructure that will reach to the east and dominate the core area of the neighborhood. A few of these locations will change, including stores, clinics, schools, and playgrounds. The fact that the town located in the western portion of the town will stay the same in the future design is also fascinating.

  • The Police Budget for 2017 and 2018 in One Area of Britain. IELTS Cambridge 17 – Test 2 (Task 1)

    \"\"

    Question – The table and charts below give information on the police budget for 2017 and 2018 in one area of Britain. The table shows where the money came from, and the charts show how it was distributed. Summarise the information by selecting and reporting the main features, and making relevant comparisons.

    The table and charts present data regarding the police budget in a particular British locality during the years 2017 and 2018. The money\’s sources are shown in the table, and the charts show how the money was spent.

    In 2018, there was a notable increase in the budget compared to 2017, with a greater contribution from local taxes. The amount of money spent on transportation and building was the same in both years.

    The budget for law enforcement received 175.5 million from the federal government in 2017 and 177.8 million in 2018. When comparing 2018 local taxes to 2017 (91.2m), they increased by almost 10m (102.3m). The amount of money from grants and other outside sources was roughly the same in both years, at 38 million.

    Three-quarters of the entire budget (75%) in 2017 was allocated to paying officers\’ and employees\’ salaries; in 2018, that amount dropped to 69%. In both 2017 and 2018, the amount allocated to building and transportation did not change. seventeen percent. In 2018, the percentage of time spent on technology was 14%, compared to 8% in 2017.

  • Information about How Families in One Country Spent Their Weekly Income. IELTS Cambridge 17 – Test 3 (Task 1)

    \"\"

    Question – The chart below gives information about how families in one country spent their weekly income in 1968 and in 2018.

    The data on weekly income expenditures by the average family in a particular nation between 1968 and 2018 is displayed in a bar graph.

    Overall, over the course of the 50-year period, spending on housing and recreation has risen significantly while spending on food has decreased significantly, suggesting that the preference for these areas of spending has surpassed that of food.

    In 1968, the biggest expenditure category was food, making up 35% of the family\’s weekly income. Housing and clothing/footwear came in second and third, respectively, accounting for 10% of a family\’s average weekly income. However, the amount spent on food showed a significant shift in 2018 compared to 1968, accounting for only roughly 17% of the average family\’s weekly income.

    In contrast, the areas with the highest spending in 2018 were housing and recreation. Housing and leisure spending saw a sharp increase in comparison to the preceding period, rising from 10% and 9% in 1968 to 19% and 22% in 2018, respectively. Plus, in 1968 families only paid 8% of their weekly income for transportation; by 2018, that number had risen to 16%. In addition, the share of spending on personal goods, fuel and power, and apparel and footwear decreased in 2018 compared to 1968.

  • The chart shows the number of shops that closed and the number of new shops opening in a country from 2011 to 2018. IELTS Cambridge 17-TEST 4 (Task 1)

    \"\"

    Question-The chart shows the number of shops that closed and the number of new shops opening in a country from 2011 to 2018. Write atleast 150 words

    The line graph shows the total number of stores that opened and closed in a specific nation between 2011 and 2018.

    In general, there were unpredictable trends for both closures and openings, and at the end of the period, both were declining. The number of newly opened stores, however, decreased more noticeably. During the majority of the period, the number of closed shops was higher and experienced a more notable low, whereas the trajectory of newly opened shops showed greater stability.

    Openings at the start of the timeline were recorded at about 8,500 stores, a significant number compared to closures, which were recorded at less than 6,500 stores. The trends in both categories were essentially the same, although opened shops saw a more pronounced decline, plunging to a low of less than 4,000 in 2012 before gradually rising to over 6,000 in 2014. Moreover, closures decreased marginally to 6,000 in 2012, increased to a high of over 7,000 in 2013, and then decreased to 6,500 in 2014.

    The number of closed stores experienced a sharp decline, reaching a low of about 500, but the number of openings declined only slightly, to 4,000 in 2015. Openings were relatively flat at 4,000 until 2017, when there was a decline to 3,000 in 2018. In contrast, closures recovered to over 5,000 before plateauing until the end of the period.