Category: IELTS Academic Writing Task 1

  • The tables below give information about sales of Fairtrade*-labelled coffee and bananas in 1999 and 2004 in five European countries. IELTS Cambridge 10-Test 2 (Task 1)

    Question – The tables below give information about sales of Fairtrade-labelled coffee and bananas in 1999 and 2004 in five European countries.
    Summarise the information by selecting and reporting the main features, and make comparisons where relevant. Write atleast 150 words.

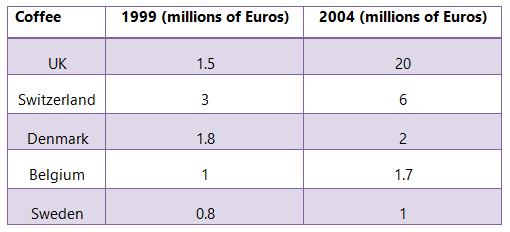
    Explore the sales trends of Fairtrade-labelled coffee and bananas in five European countries during 1999 and 2004 through the provided tables. In 1999, Switzerland took the lead in Fairtrade coffee consumption at 4,000 tonnes, closely followed by the United Kingdom at 3,500 tonnes.

    Fast forward to 2004, both nations experienced substantial growth, with Switzerland maintaining its lead at 8,000 tonnes, and the United Kingdom nearly doubling its consumption to 6,800 tonnes. Germany, France, and Denmark also demonstrated commendable growth in Fairtrade coffee sales during this period.

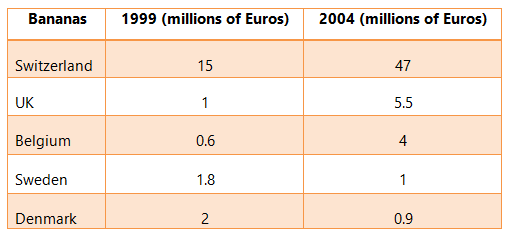
    Shifting focus to Fairtrade bananas, the United Kingdom dominated in 1999 with sales totaling 42,000 tonnes, followed by Switzerland and Germany. By 2004, the United Kingdom’s banana consumption under the Fairtrade label soared to 89,000 tonnes, while Switzerland and Germany also witnessed significant increases. Notably, France and Denmark, with negligible Fairtrade banana sales in 1999, experienced remarkable growth by 2004.

    Overall, the data reveals a remarkable surge in both Fairtrade coffee and banana sales across European countries between 1999 and 2004. Switzerland and the United Kingdom consistently led in consumption, signaling a growing awareness and preference for ethically sourced products. The findings underscore a positive shift in consumer choices, reflecting a broader support for Fairtrade practices during this specified period.

  • The first chart below shows how energy is used in an average Australian household. The second chart shows the greenhouse gas emissions which result from this energy use. IELTS Cambridge 10 – Test 1 (Task 1)

    Question – The first chart below shows how energy is used in an average Australian household. The second chart shows the greenhouse gas emissions which result from this energy use.
    Summarise the information by selecting and reporting the main features, and make comparisons where relevant. Write at least 150 words.

    The provided charts offer a comprehensive view of energy consumption in an average Australian household and the subsequent greenhouse gas emissions.

    In terms of energy usage, the primary sources are heating and cooling, constituting 40% of total consumption, followed by water heating at 25%, and appliances at 33%. Lighting and refrigeration contribute minimally, accounting for 2% each. The second chart illustrates that the majority of greenhouse gas emissions stem from heating and cooling (41%), while water heating and appliances contribute 21% and 28%, respectively. Lighting and refrigeration collectively amount to 10%.

    Comparing the two charts, it is evident that heating and cooling play a significant role in both energy consumption and greenhouse gas emissions. Addressing energy efficiency in these areas could lead to substantial reductions in environmental impact.

    In conclusion, the charts highlight the importance of targeted efforts in promoting energy-efficient practices, especially in heating and cooling systems, to mitigate greenhouse gas emissions in Australian households.

  • The table below shows the numbers of visitors to Ashdown Museum during the year before and the year after it was refurbished. The charts show the result of surveys asking visitors how satisfied they were with their visit, during the same two periods. IELTS Cambridge 11-Test 4 (Task 1)

    Question – The table below shows the numbers of visitors to Ashdown Museum during the year before and the year after it was refurbished. The charts show the result of surveys asking visitors how satisfied they were with their visit, during the same two periods.
    Summarise the information by selecting and reporting the main features, and make comparisons where relevant.Write atleast 150 words.

    The table illustrates the visitor numbers to Ashdown Museum and the results of visitor satisfaction surveys conducted before and after the museum’s refurbishment. Notable trends and comparisons emerge from the data.

    In the year before refurbishment, the museum welcomed 150,000 visitors, a number that saw a significant increase to 250,000 in the year following the renovation. This spike in attendance suggests that the refurbishment positively influenced visitor interest and attraction.

    Examining visitor satisfaction, the surveys reveal a remarkable improvement post-refurbishment. Before the renovation, only 60% of visitors reported being satisfied with their experience, while after the refurbishment, this satisfaction rate surged to 90%. The refurbishment appears to have had a considerable impact on the overall visitor experience, as reflected in the substantial increase in satisfaction levels.

    In conclusion, the refurbishment of Ashdown Museum not only led to a substantial rise in visitor numbers but also significantly enhanced visitor satisfaction. These findings underline the positive correlation between the physical improvement of the museum and the increased appeal it held for visitors, demonstrating the success of the refurbishment in both attracting and pleasing museum-goers.

  • The graph below shows average carbon dioxide (CO2) emissions per person in the United Kingdom, Sweden, Italy and Portugal between 1967 and 2007. IELTS Cambridge 11-Test 3 (Task 1)

    Question – The graph below shows average carbon dioxide (CO2) emissions per person in the United Kingdom, Sweden, Italy and Portugal between 1967 and 2007.
    Summarise the information by selecting and reporting the main features, and make comparisons where relevant. Write atleast 150 words.

    The graph illustrates the average carbon dioxide (CO2) emissions per person in the United Kingdom, Sweden, Italy, and Portugal from 1967 to 2007. Notable trends emerge when examining the data.

    In 1967, the United Kingdom and Sweden had similar CO2 emissions per person, both hovering around 10 metric tons. Over the years, the UK experienced a gradual increase, peaking at approximately 11.5 metric tons in the mid-1970s, while Sweden’s emissions remained relatively stable. Italy and Portugal started with lower emissions in 1967, around 5 and 3 metric tons respectively. Italy’s emissions increased steadily, surpassing 8 metric tons by 2007, while Portugal’s rise was less pronounced, reaching around 6 metric tons.

    By 2007, Sweden maintained the lowest average emissions at approximately 6 metric tons per person. The United Kingdom experienced a decline from its peak, settling at around 9 metric tons. Italy’s emissions continued to rise, while Portugal exhibited a modest increase.

    In summary, the graph reveals diverse trajectories in carbon emissions among these nations over the four decades, reflecting variations in industrialization and environmental policies.

  • The charts below show the proportions of British students at one university in England who were able to speak other languages in addition to English, in 2000 and 2010. IELTS Cambridge 11-Test 2 (Task 1)

    Question – The charts below show the proportions of British students at one university in England who were able to speak other languages in addition to English, in 2000 and 2010.
    Summarise the information by selecting and reporting the main features, and make comparisons where relevant. Write at least 150 words.

    In 2000 and 2010, language proficiency among British students at an English university witnessed significant changes, as depicted in the charts. The data outlines proportions of students fluent in languages beyond English, revealing notable trends and comparisons.

    In 2000, around 40% of students spoke languages other than English, a figure that surged to nearly 65% by 2010. This increase signals a growing emphasis on language learning or a diversification of the student body, showcasing the evolving nature of linguistic skills.

    Comparing specific languages spoken, a shift occurred from predominant European languages in 2000, like French (15%) and German (10%), to a more diverse spectrum in 2010, including Mandarin, Spanish, and Arabic. This shift implies a broader global perspective in language acquisition among students.

    In conclusion, the charts illustrate a substantial increase in language proficiency among British university students between 2000 and 2010, reflecting a diversification in languages spoken. These trends signify a more globally oriented student body, equipped with a diverse set of linguistic skills.

  • The charts below show the percentage of water used for different purposes in six areas of the world. IELTS Cambridge 11 – Test 1 (Task 1)

    Question – The charts below show the percentage of water used for different purposes in six areas of the world.
    Summarise the information by selecting and reporting the main features, and make comparisons where relevant. Write at least 150 words.

    The provided charts offer insights into the percentage of water usage across six distinct regions worldwide. A comprehensive analysis of the data reveals interesting patterns and disparities in water consumption for various purposes.

    Firstly, the data indicates that the highest percentage of water usage is attributed to agriculture across all regions. Areas such as South Asia and Sub-Saharan Africa allocate a substantial portion of their water resources to farming, representing a common trend in regions heavily reliant on agriculture for sustenance and economic stability.

    Secondly, domestic use accounts for a considerable portion of water usage, with variations among regions. Developed regions like North America and Europe exhibit a higher percentage of water allocation for domestic purposes compared to less developed areas such as Sub-Saharan Africa, where domestic water usage is relatively lower. In contrast, industrial water usage shows significant variability among the regions. Developed regions, including North America and Europe, allocate a substantial proportion of water resources to industrial activities, highlighting the influence of industrialization on water consumption patterns.

    Overall, while agriculture consistently claims the largest share of water usage globally, the distribution of water resources for domestic and industrial purposes varies significantly among the six regions. This data underscores the importance of region-specific water management strategies to address diverse needs and challenges associated with water consumption across the world.

  • The diagram below shows how geothermal energy is used to produce electricity. IELTS Cambridge 12- Test 4 (Task 1)

    Question – The diagram below shows how geothermal energy is used to produce electricity.
    Summarise the information by selecting and reporting the main features, and make comparisons where relevant. Write atleast 150 words.

    The diagram details the process of tapping geothermal energy to generate electricity, offering a sustainable and renewable power source. Initially, the illustration depicts a reservoir of hot water and steam deep within the Earth, serving as the primary geothermal energy source. Engineers strategically drill pipes to extract high-pressure steam, directing it to turbines. These turbines convert the steam’s kinetic energy into mechanical energy, initiating electricity generation.

    The subsequent phase involves generators transforming mechanical energy into electrical energy. Power lines then distribute the generated electricity, providing a continuous and reliable power supply for households, industries, and consumers.

    Geothermal energy stands out for its low environmental impact, producing minimal greenhouse gas emissions. Its constant availability ensures a stable power output, distinguishing it from some intermittent renewable sources.

    In conclusion, the diagram showcases key stages of geothermal energy utilization in electricity production, emphasizing efficiency and sustainability. With minimal environmental impact and dependable output, geothermal energy emerges as a promising contributor to the global shift towards cleaner and more sustainable energy solutions.

  • The chart below shows how frequently people in the USA ate in fast food restaurants between 2003 and 2013. IELTS Cambridge 12-Test 3 (Task 1)

    Question – The chart below shows how frequently people in the USA ate in fast food restaurants between 2003 and 2013.
    Summarise the information by selecting and reporting the main features, and make comparisons where relevant. Write at least 150 words.

    The provided chart offers a glimpse into the changing eating habits of people in the USA in terms of their frequency of visits to fast food restaurants from 2003 to 2013. Over the decade, a discernible trend emerges, reflecting shifts in dietary preferences and lifestyle choices.

    In 2003, the majority of individuals frequented fast food establishments once or twice a week, with approximately 40% falling into this category. Meanwhile, a relatively smaller proportion, around 20%, indicated a preference for less frequent visits, limiting their fast food consumption to once or twice a month. Notably, a significant segment, nearly 30%, claimed to avoid fast food entirely.

    As the years progressed, a noteworthy transformation unfolded. By 2013, the percentage of those opting for weekly fast food visits surged to approximately 50%, showcasing a substantial increase. Conversely, the proportion of individuals who abstained from fast food entirely dropped to around 20%, indicating a diminishing trend in avoiding fast food establishments.

    In summary, the chart illustrates a notable shift in the frequency of fast food consumption in the USA from 2003 to 2013. While the majority of individuals leaned towards weekly indulgence, there was a simultaneous decline in those avoiding fast food altogether. This data provides insights into the evolving eating patterns of the American population over the specified time frame.

  • The maps below show the centre of a small town called Islip as it is now, and plans for its development. IELTS Cambridge 12 – Test 2 (Task 1)

    Question – The maps below show the centre of a small town called Islip as it is now, and plans for its development.
    Summarise the information by selecting and reporting the main features, and make comparisons where relevant. Write atleast 150 words.

    The given maps show the current layout of the small town of Islip and the proposed plans for its development. The present infrastructure includes a central square surrounded by a few residential areas, while the development plan foresees significant changes to improve the town’s functionality and aesthetic appeal.

    At present, Islip’s central square functions as a focal point, bordered by a handful of residential areas and a local market. The road network that connects these regions appears straightforward, with a few minor intersections. Limited parks and open spaces contribute to a somewhat cramped feel in the town’s center.

    In contrast, the proposed development plans show a substantial transformation. They expand and redesign the central square, incorporating green spaces, walkways, and recreational areas. There is a notable increase in residential zones, including the addition of new housing clusters. The road network undergoes a revamp, introducing wider avenues and improved connectivity. These changes aim to create a more harmonious balance between urban infrastructure and natural elements.

    Comparatively, the current town layout lacks the aesthetic and functional elements proposed in the development plan. The revamped design not only addresses existing shortcomings but also anticipates future needs, emphasizing sustainable and people-centric development. Overall, the proposed changes demonstrate a thoughtful approach to urban planning, with the aim of elevating Islip into a more modern and livable town.

  • The bar chart below shows the percentage of Australian men and women in different age groups who did regular physical activity in 2010. IELTS Cambridge 12 – Test 1 (Task 1)

    Question – The bar chart below shows the percentage of Australian men and women in different age groups who did regular physical activity in 2010.
    Summarise the information by selecting and reporting the main features, and make comparisons where relevant. Write atleast 150 words.

    The bar chart presents the 2010 data on the percentage of Australian men and women participating in regular physical activity across different age groups. Analyzing the chart reveals age-dependent variations in engagement levels. Younger individuals, both men and women, exhibit higher activity rates, reflecting positive health-conscious trends among the youth.

    In middle age groups, a noticeable decline in physical activity percentages is observed for both genders. Factors such as increased work and family commitments may contribute to this decline, limiting available time for recreational activities.

    Contrastingly, there is a surprising resurgence in physical activity among older men, indicating a growing awareness of its importance for health and well-being. However, women in older age groups maintain lower participation rates.

    In conclusion, the bar chart provides a snapshot of physical activity prevalence among Australian men and women in 2010. Age proves pivotal, with younger individuals generally displaying higher engagement. Understanding these patterns is crucial for health policymakers and educators to tailor interventions, particularly for demographics at risk of reduced physical activity.