


Question –The charts below give information about USA marriage and divorce rates between 1970 and 2000, and the marital status of adult Americans in two of the years.
Summarise the information by selecting and reporting the main features, and make comparisons where relevant.Write at least 150 words.
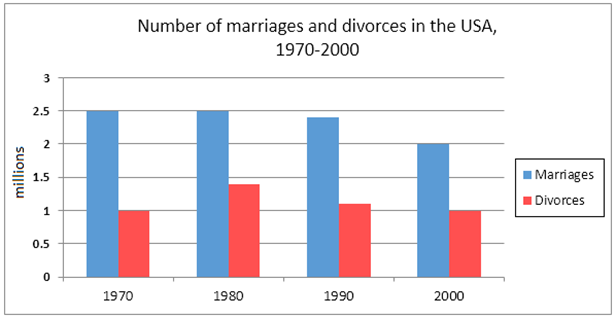
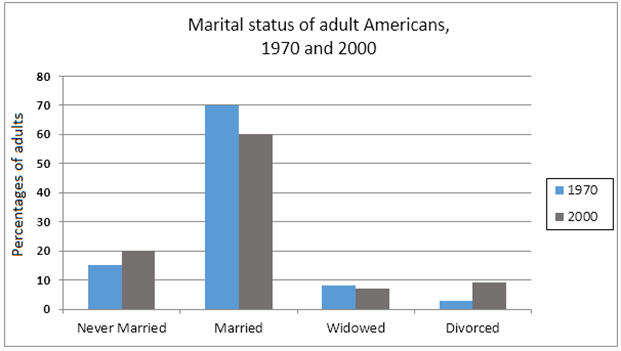
The first chart shows the evolution of the US marriage and divorce rates over a thirty-year span beginning in 1970. In the second chart, the percentage of American adults in each of the two years—1970 and 2000—who were married varies.
In general, the number of marriages in the US was clearly declining. Despite the fact that the majority of adult Americans were married in both of the years that data were available, the number of single people in 2000 was significantly higher.
In 1970–1980, there were 2.5 million marriages registered in America; by 2000, that figure had dwindled to 2 million. By comparison, in 1970 there were about a million divorces filed; ten years later, that number rose to nearly 1.5 million. Since then, there have been fewer divorces, and in 2000, there were exactly 1 million divorces, or 50% fewer marriages than there were marriages.
In 1970, the proportion of married adults in America was 70%; by 2000, it was only about 60%. In a similar vein, the percentage of widows slightly decreased. The numbers for singles and divorced individuals increased slightly, by about 8% in each case.