


Question –The graph below shows the proportion of the population aged 65 and over between 1940 and 2040 in three different countries.
Summarise the information by selecting and reporting the main feature and make comparisons where relevant.Write at least 150 words.
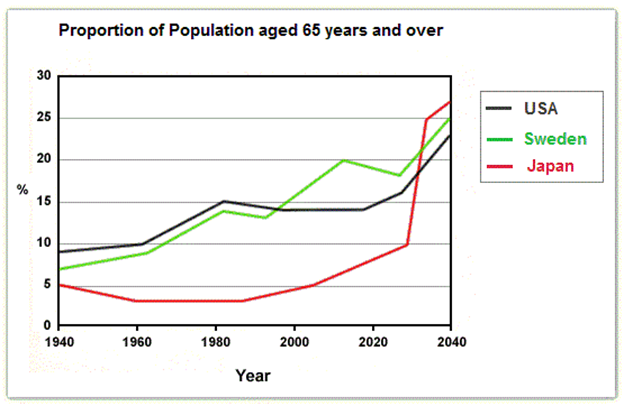
The percentage of people 65 years of age or older in three different countries between 1940 and 2040 is depicted in the line graph.
Overall, it is evident that while the percentage of the population in Japan declines from 1940 to 1980 before a sharp increase in the number of elderly people occurs there, the percentage of people aged 65 and over increases in the USA and Sweden from 1940 to 2040 with only minor dips in between.
When compared to Sweden (approximately 7%), the United States (just under 10%) had a higher percentage of elderly residents in 1940; Japan (only 5%) came in second. The percentage of elderly people in the USA increased between 1940 and 1980 before slightly declining after that. But it’s expected that this number will eventually rise, reaching 2040. The percentage of older people in Sweden increased from 1940 to 2040, with two gradual declines from 1980 to 1990 and from 2010 to 2025. This result follows a similar pattern.
Regarding Japan, it can be observed that prior to an upward trend, the percentage of the population that was older was slightly lower between 1940 and 1990. It is anticipated that starting in 2030, the number will rise sharply and peak in 2040. The United States will have the fewest elderly citizens among the three countries, while Japan will have the greatest.